MapCreator application provides an instant view to map analytics. This feature helps you to analyze the quality of the signal maps and map coverage while you are iteratively recording new fingerprint paths.
It's a good practice to use mapping analytics to ensure that your fingerprinting process is producing high-quality signal maps and good map coverage. You can use the mapping analytics while recording fingerprint paths – this helps you to focus on areas where more data is needed. |


The map analytics has six parts (local = on the device end, cloud = on the cloud end; based on uploaded paths)
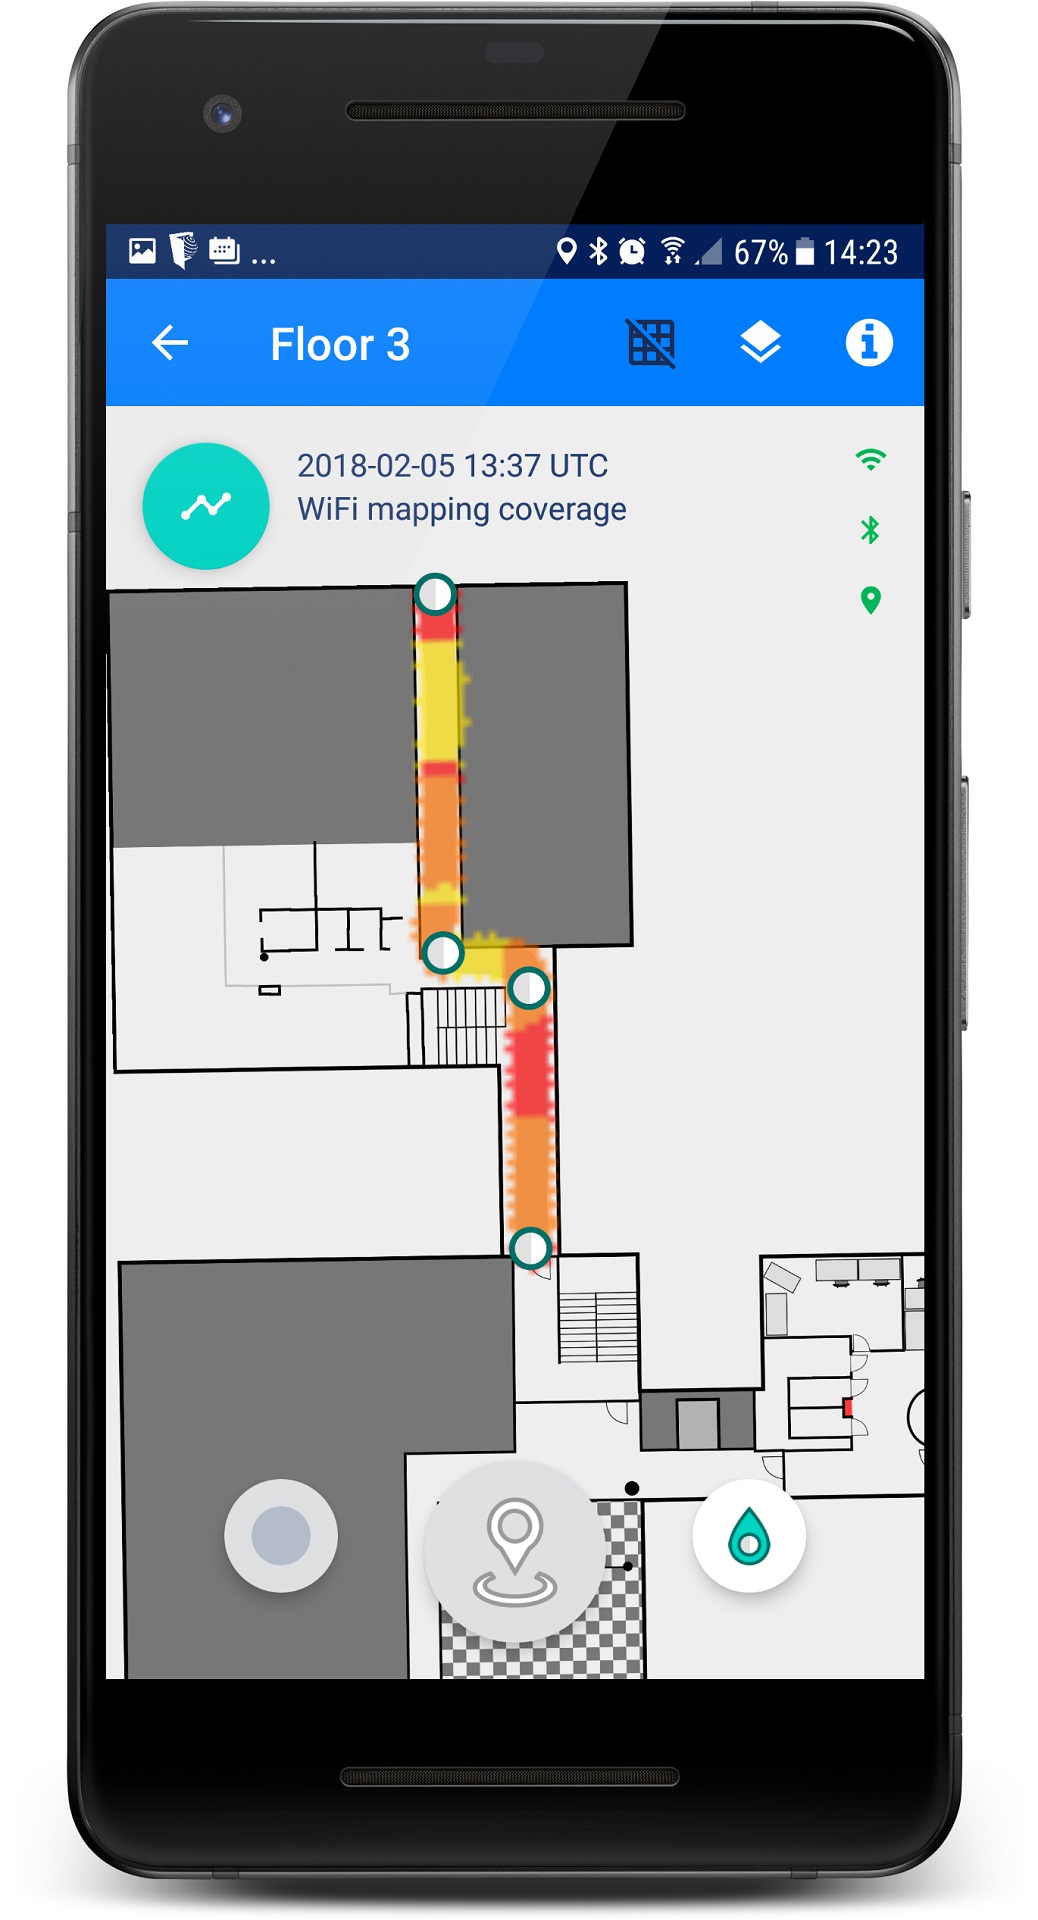
- Wi-Fi mapping coverage tells how many Wi-Fi signal observations (or scans) the MapCreator has recorded for a particular venue area. Green areas have more scans than red areas, for which you should consider recording more signal paths
- Wi-Fi environment quality tells how many different Wi-Fi access points the MapCreator has registered. In green areas, more Wi-Fi access points have been registered than in red areas. Adding and removing access points affects the Wi-Fi environment quality
- Magnetic coverage provides information about the coverage of magnetic field observations. In green areas, more observations have been made than in red areas. You may need to record more fingerprinting paths in red areas. IndoorAtlas uses the geomagnetic field map of the venue to improve the tracking performance of the indoor positioning system
- Mapping quality and coverage view is mainly based on the quality of the magnetic field data provided by the digital magnetometer of the fingerprinting device. The view shows in RED color the map areas whose fingerprinting data is in conflict with itself, i.e., the overlapping/nearby fingerprinting data in these areas do not match. The GREEN color in the view indicates that the overlapping fingerprinting data matches well, and the BLUE color indicates areas where no overlapping data is available for analytics, i.e., you don't have multiple fingerprinting paths close to each other on blue areas
- Beacon environment quality tells how many different beacons the MapCreator has registered. In green areas, more beacons have been registered than in red areas. Adding and removing beacons, and tuning the signal strengths of the beacons affect the beacon environment quality. By default, IndoorAtlas for iOS requires a beacon deployment for good positioning performance and for the fast first fix. Note: if you add beacons later, you need to record new fingerprint paths to include the new beacon signals in the updated signal map
- Show uploaded paths shows all paths that have been recorded and saved to the cloud. You can use this information to check the fingerprinting coverage and to coordinate the fingerprinting effort between multiple MapCreator users.
Additional tips for using mapping analytics during fingerprinting
- Check regularly the Wi-Fi mapping coverage (left image) and see if you need to collect more data before you move to the next area. Note: Wi-Fi scanning frequency varies depending on the phone model. For professional deployments, you should always use a phone that has good Wi-Fi scanning frequency – see qualifying a mapping device for more information.
- Check regularly the beacon environment quality (right image) and see instantly where you need to add more beacons. Note: this is relevant only if you have deployed beacons. The beacon environment quality should turn green when you collect paths in the area where you have beacons. In the example image, you may want to add beacons to turn the red/yellow areas green.
 |